Smart Schedule Sandbox |

|

|

|
|
Smart Schedule Sandbox |

|

|

|
|
|
||
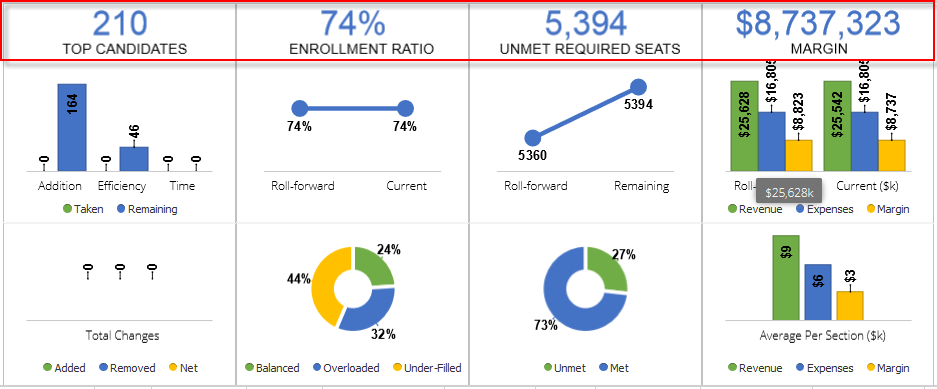
The Smart Schedule Sandbox is an interactive section file that allows users to review tentative offerings for an upcoming term and modify those offerings. It prompts users with high-impact, positive recommendations to improve the efficiency and margin of the schedule. A user can easily see how changes effect the schedule by viewing the key metrics dashboard. The key metric data is refreshed dynamically with each change. The Smart Schedule Sandbox is available with Platinum Analytics 8.0.
To expand/collapse the key metrics area, click anywhere inside the key metrics area (highlighted in red box, below). The key metrics are updated with any schedule changes.

Definitions:
Top Candidates: The highest-impact positive change candidates (addition, reduction, elimination), displayed as number of sections. Users should consider accepting these recommendations to improve the efficiency and margin of the academic schedule.
Enrollment Ratio: Average enrollment divided by average course enrollment cap (last like term).
Unmet Required Seats: The number of seats needed in required courses that are not currently offered in the analysis term. Note: This value is a number of seats, not students. One student could have more than one required seat counted in this number.
Margin: The delta between revenue and expenses, based on Instructor Type cost and tuition rates.
The course/section data is displayed in a "nested" grid so the sections be collapsed until a user expands a course. Users can expand/collapse section information by using the + icon on a course row.

To customize which columns are displayed on the grid:
1.Hover over any column header
2.Click the down arrow that appears on the right side of the column header to open column options
3.Hover over the Columns area to expand the list of available columns
4.Check desired columns and uncheck columns that should not display
To reorder columns:
1.Click and hold the mouse on a column header
2.Drag the column header to the desired location (between two other columns)
3.Release the mouse when two green arrows appear between the columns
To lock columns to the left side of the grid:
1.Click and hold the mouse on the desired column header
2.Click the down arrow that appears on the right side of the column header to open column options
3.Select Lock
To unlock columns from the left side of the grid:
1.Click and hold the mouse on the desired column header
2.Click the down arrow that appears on the right side of the column header to open column options
3.Select Unlock
See also:
Review and Accept Recommendations
View Course-specific Demand Data
Run Simulated Registration