Base Predictive Data Results |

|

|

|
|
Base Predictive Data Results |

|

|

|
|
|
||
When the Base Predictive Data analysis process is complete, you may click on the sandbox file on the list to view the results. Results data includes:
•Statistics summary panel
Roll-up statistics for the students in the analysis
•Summary tab
Totals and statistics by subject and course
•By Program/Rule/SubRule/Delivery Method tabs
A detailed list of data per program, rule, subrule, and delivery method in the analysis
•Students tab
A list of all students in the analysis with details about the student and their academic history
The Statistics panel displays a number of totals related to the overall Base Predictive Data sandbox.

Once the sandbox is saved and the data gathered, a user may re-enter the sandbox and view the calculated Results, including the following:
•Total Students
The total # chosen by the student selector during setup
•Total Valid Students
The students that had academic history and were assigned to a program version for the degree audit
•Total Graduated Students
The number of students found that were marked as graduated ("is graduated" or student status indicator)
•Students With No Program Version
The number of students for whom no program version was assigned in the data
•Students With No Academic History
The number of students for whom there was no academic history (typically freshmen)
•Students With No Applied Credits
The number of students for whom the system ran a degree audit but did not find anything in their academic history that applied to their indicated program version
The first Results tab, displayed by default, is the Summary tab. This tab displays a number of statistics and totals by subject and course.
Notable examples include:
•# of Programs
The number of distinct programs with which students were associated when taking the course
•# of Students
The number of students in the analysis that completed the course as part of their program requirements
•Average Grade
The average grade received by students taking the course
•Min, Average, and Max Credits
The smallest, largest, and average credits that the analysis students had at the time they took the course. This is important for Program Template bracketing (when is a course typically taken in a student's academic career)

The Results tab also includes Program, Rule, SubRule, and Delivery Method tabs, displaying a number of details per program, rule, subrule, and delivery method.
Notable examples include:
•Total Students
The number of students in the program, or associated with the rule, etc
•# of Students
The number of students that completed the course in question
•% Probability
The relationship between the number of students that took the course to the total students that had the same requirement
•% Requirement
The calculated requirement rating based on the number of choices available to satisfy rules

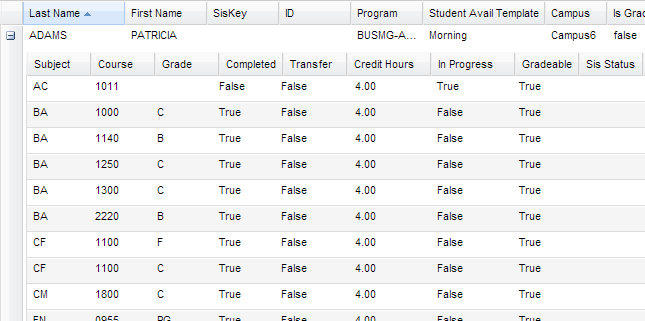
The final Results option is the Students tab, which displays a student profile information and details on their academic history.
Notable examples include:
•Program
•Student Availability Template
The Astra Schedule Availability Template to which they are assigned. These templates inform the system when students are available to attend classes.
•Campus
•Reason
The reason column provides a space for comments if there were problems found with the student record during the analysis.

For each student in the list, you may click the + button to expand the grid and view the academic history that was found for the student.
